matplotlib 绘制多图时合并部分区域

matplotlib 中 subplots 时,合并多个子图, 实现类似 Excel中 “合并单元格”的功能。

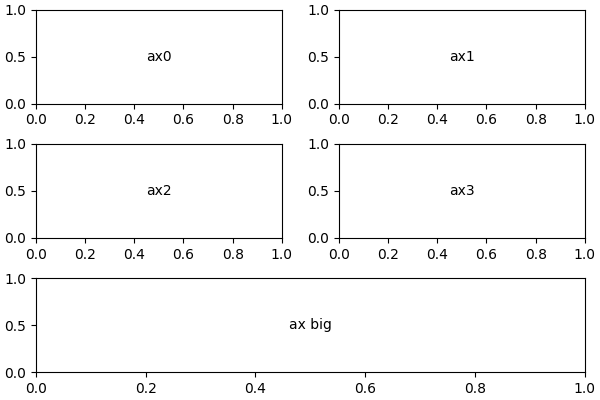
例如:创建一个 3 行 2 列的 figure,将最后一行合并

1
2
3
4
5
6
7
8
9
10
11
12
13
14
15
16
17
18
import matplotlib.pyplot as plt

# 创建一个 3 行 2 列的 figure,将最后一行合并
fig, axes = plt.subplots(3, 2, constrained_layout=True)
# 删除画布中要合并位置的子图
for ax in axes[-1, :]:
ax.remove()
axes = axes[:-1]
# 添加大的子图,覆盖整行
gs = axes[0,0].get_gridspec()
axbig = fig.add_subplot(gs[-1, :])

# 添加说明文字
axes = axes.reshape(-1)
for idx,ax in enumerate(axes):
ax.text(0.5, 0.5, "ax%d" % (idx), va="center", ha="center")
axbig.text(0.5, 0.5, "ax big", va="center", ha="center")

效果: